oriT_test <- read_tsv("test_oriT.tsv", col_names = F)
oriT_test <- oriT_test[!duplicated(oriT_test$X7),]
pipolin_summary <- read_tsv("pipolin_summary_new.tsv")
taxonomy_data <- pipolin_summary[,c(3,34,38:44)]
rm(pipolin_summary)oriT
Files
Los archivos usados son los resultados mediante un script que busca posibles oriTs en pipolinas bacterianas y un compendio de datos sobre todos los genomas disponibles, del cuál solo nos interesa sus datos taxonómicos y su ID.
Obtaining the Genome_ID
En este caso, como la información que contiene el Genome_ID siempre va seguida de sólo dos posbiles strings (“_0v0” y ”_1v0”), podemos simplemente sustituir estas terminaciones por un espacio vacío (““) usando gsub().
colnames(oriT_test) <- c("Genome_ID", "subject acc.ver", "% identity", "alignment length", "mismatches", "gap opens", "q. start", "q. end", "s. start", "s. end", "evalue", "bit score")
oriT_test$Genome_ID <- gsub("_0v0", "", oriT_test$Genome_ID)
oriT_test$Genome_ID <- gsub("_1v0", "", oriT_test$Genome_ID)

oriT_test_merged <- merge(oriT_test, taxonomy_data, by="Genome_ID")
oriT_test_merged <- unique(oriT_test_merged)
Counting the occurrence of oriTs
Nos interesa saber la cantidad de genomas que tienen 0, 1, 2, 3, etc. oriTs. Para ello hacemos un df con todos los genomas y le agregamos la información taxonómica usando merge().
oriT_name <- as.vector(names(table(oriT_test_merged$Genome_ID)))
oriT_count <- as.vector(table(oriT_test_merged$Genome_ID))
oriT_df <- data.frame(oriT_name, oriT_count)
oriT_df <- distinct(oriT_df)
names(oriT_df) <- c("Genome_ID","Count")

df_temp <- data.frame(oriT_test_merged$Genome_ID, oriT_test_merged$Genus_rev)
df_temp <- distinct(df_temp)
names(df_temp) <- c("Genome_ID","Genus_rev")

oriT_df_merged <- merge(oriT_df, df_temp, by="Genome_ID")
Plots
El gráfico muestra qué cantidad de genomas tienen n número de oriTs, coloreado según pertenencia a un género bacteriano relevantes. En este caso, desde un principio sólo hemos contado los pipolinas que tengan al menos 1 oriT.
#nº of oriTs
ggplot(oriT_df_merged, aes(Count, fill=Genus_rev)) + geom_bar(stat="count") +
  xlab("Nº of oriTs") + ylab("OCCURRENCE")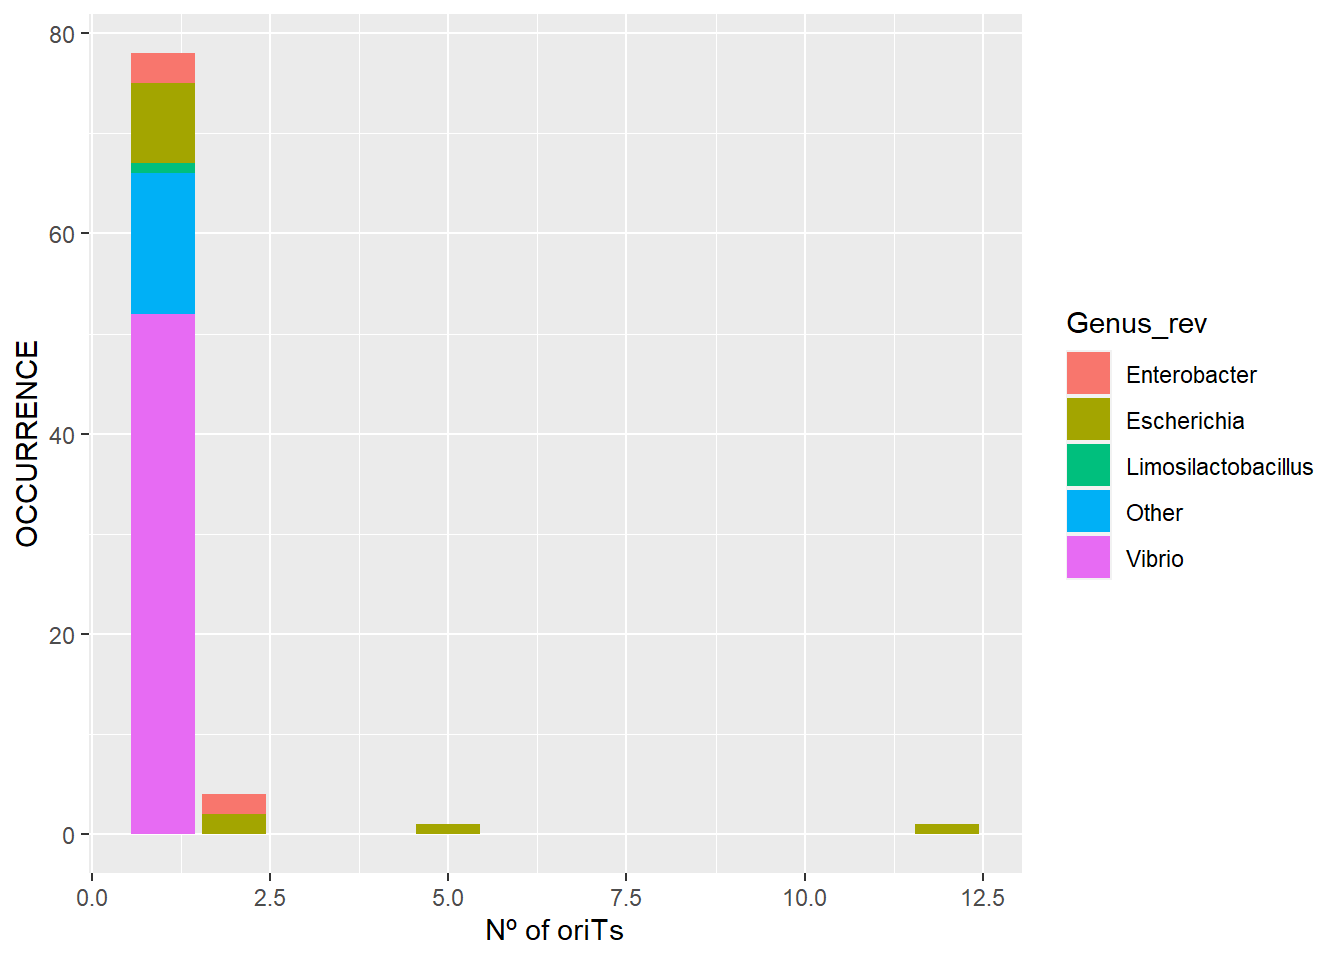
Session Info
R version 4.3.2 (2023-10-31 ucrt)
Platform: x86_64-w64-mingw32/x64 (64-bit)
Running under: Windows 11 x64 (build 22631)

Matrix products: default


locale:
[1] LC_COLLATE=Spanish_Spain.utf8  LC_CTYPE=Spanish_Spain.utf8
[3] LC_MONETARY=Spanish_Spain.utf8 LC_NUMERIC=C
[5] LC_TIME=Spanish_Spain.utf8

time zone: Europe/Madrid
tzcode source: internal

attached base packages:
[1] stats     graphics  grDevices utils     datasets  methods   base

other attached packages:
 [1] lubridate_1.9.3 forcats_1.0.0   stringr_1.5.1   dplyr_1.1.4
 [5] purrr_1.0.2     readr_2.1.4     tidyr_1.3.0     tibble_3.2.1
 [9] tidyverse_2.0.0 ggplot2_3.4.4

loaded via a namespace (and not attached):
 [1] bit_4.0.5         gtable_0.3.4      jsonlite_1.8.8    crayon_1.5.2
 [5] compiler_4.3.2    tidyselect_1.2.0  parallel_4.3.2    scales_1.3.0
 [9] yaml_2.3.7        fastmap_1.1.1     R6_2.5.1          labeling_0.4.3
[13] generics_0.1.3    knitr_1.45        htmlwidgets_1.6.3 munsell_0.5.0
[17] pillar_1.9.0      tzdb_0.4.0        rlang_1.1.2       utf8_1.2.4
[21] stringi_1.8.2     xfun_0.41         bit64_4.0.5       timechange_0.2.0
[25] cli_3.6.1         withr_2.5.2       magrittr_2.0.3    digest_0.6.33
[29] grid_4.3.2        vroom_1.6.4       rstudioapi_0.15.0 hms_1.1.3
[33] lifecycle_1.0.4   vctrs_0.6.4       evaluate_0.23     glue_1.6.2
[37] farver_2.1.1      fansi_1.0.5       colorspace_2.1-0  rmarkdown_2.25
[41] tools_4.3.2       pkgconfig_2.0.3   htmltools_0.5.7