data_vf <- read.csv("virulencefinder_output.csv", stringsAsFactors = F)
pipolin_summary <- read_tsv("pipolin_summary_new.tsv")
#"viruelencefinder_output.csv" se encuentra comprimdo en un archivo .zip
taxonomy_data <- pipolin_summary[,c(3,34,38:44)]
rm(pipolin_summary)Virulencefinder
Files
Los archivos usados son los resultados obtenidos con el script virulencefinder_to_csv.py y un compendio de datos sobre todos los genomas disponibles, del cuál solo nos interesa sus datos taxonómicos y su ID.
Obtaining the Genome_ID
Los datos del Genome_ID se pueden obtener de los hits de cada genoma. Para extraer sólo cierta parte de una string podemos usar la función str_extract() del paquete stringr. En este caso, para todos los genomas que tiene AL MENOS UNA virulencia, se puede extraer de el Genome_ID con sólo extraer la información de las columnas “stx” y “s.aureus_toxin”.
# THIS IS TO OBTAIN THE GENOME_ID
data_vf_new<-as.data.frame(data_vf[-c(1)])
data_vf_new$Genome_ID<-NA
data_vf_new$Genome_ID<-stringr::str_extract(string = data_vf_new$stx, pattern = "G_[0-9]+")
data_vf_new$Genome_ID[which(grepl("G_\\d+", data_vf_new$Genome_ID)==F)]<-stringr::str_extract(string = data_vf_new$s.aureus_toxin[which(grepl("G_\\d+", data_vf_new$s.aureus_toxin)==T)], pattern = "G_[0-9]+")
Warning in data_vf_new$Genome_ID[which(grepl("G_\\d+", data_vf_new$Genome_ID)
== : número de items para para sustituir no es un múltiplo de la longitud del
reemplazodata_vf_new <- data_vf_new[,c(9,1,2,3,4,5,6,7,8)]Getting rid of “No hit found”
No nos interesa tener información inútil. Así que nos vamos a deshacer de todos los “No hit found” en las 8 columnas de virulencia sustituyéndolos por “NA”. Esto se puede hacer fácil con la función grepl().
# This is to get rid of "No hit found"
data_vf_binary <- data_vf_new
data_vf_binary$virulence_ent[which((grepl("No hit found", data_vf_new$virulence_ent)==T))]<-NA
data_vf_binary$listeria[which((grepl("No hit found", data_vf_new$listeria)==T))]<-NA
data_vf_binary$s.aureus_hostimm[which((grepl("No hit found", data_vf_new$s.aureus_hostimm)==T))]<-NA
data_vf_binary$s.aureus_exoenzyme[which((grepl("No hit found", data_vf_new$s.aureus_exoenzyme)==T))]<-NA
data_vf_binary$s.aureus_toxin[which((grepl("No hit found", data_vf_new$s.aureus_toxin)==T))]<-NA
data_vf_binary$virulence_ecoli[which((grepl("No hit found", data_vf_new$virulence_ecoli)==T))]<-NA
data_vf_binary$stx[which((grepl("No hit found", data_vf_new$stx)==T))]<-NA
data_vf_binary$virulence_entfm_entls[which((grepl("No hit found", data_vf_new$virulence_entfm_entls)==T))]<-NA
Turning the results into “1”
Como he dicho antes, no necesitamos información inútil en nuestros data frames. Igual que hacíamos antes con los “No hit found”, vamos a cambiar todos los hits por “1”.
# THIS IS TO CHANGE RESULTS INTO "1"
data_vf_binary$virulence_ent[which((grepl("G_[0-9]+", data_vf_binary$virulence_ent)==T))]<-1
data_vf_binary$listeria[which((grepl("G_[0-9]+", data_vf_new$listeria)==T))]<-1
data_vf_binary$s.aureus_hostimm[which((grepl("G_[0-9]+", data_vf_new$s.aureus_hostimm)==T))]<-1
data_vf_binary$s.aureus_exoenzyme[which((grepl("G_[0-9]+", data_vf_new$s.aureus_exoenzyme)==T))]<-1
data_vf_binary$s.aureus_toxin[which((grepl("G_[0-9]+", data_vf_new$s.aureus_toxin)==T))]<-1
data_vf_binary$virulence_ecoli[which((grepl("G_[0-9]+", data_vf_new$virulence_ecoli)==T))]<-1
data_vf_binary$stx[which((grepl("G_[0-9]+", data_vf_new$stx)==T))]<-1
data_vf_binary$virulence_entfm_entls[which((grepl("G_[0-9]+", data_vf_new$virulence_entfm_entls)==T))]<-1
Stacking Virulence classes in one column
Como nos interesa analizar los datos según su tipo de virulencia, necesitamos que estas pertenezcan todas a una misma variable. Para ello, nos valemos de la función stack() . También podemos deshacernos de todas las columnas que no presentan virulencia mediante la función filter() del paquete dplyr. También podemos agregar la información taxonómica mediante merge() y deshacernos de columnas duplicadas con unique().
¿Por qué deshacernos de los duplicados si tenemos una variable Count donde podríamos almacenar la información de cuántas columnas son iguales? Sencillo, porque no nos interesa. Nos basta con saber si esa virulencia está (1) o no está (NA) en nuestro genoma.
stacked <- cbind(data_vf_binary$Genome_ID,stack(data_vf_binary[,2:8]))
names(stacked) <- c("Genome_ID","Count","Virulence")
stacked <- stacked %>%filter(!is.na(Count))
stacked <- unique(stacked)
data_vf_merge <- merge(stacked, taxonomy_data, by="Genome_ID")
vf_merge_filtered <- unique(data_vf_merge)
Counting the occurrence of virulences
Nos interesa saber la cantidad de genomas que tienen 0, 1, 2, 3, etc. virulencias. Para ello hacemos un df con todos los genomas y hacemos un merge con la información taxonómica. Si el merge lo hacemos según Genome_ID nuestro plot no mostrará la cantidad de genomas que no tienen virulencia. Para mostrar también estos últimos, el merge lo haremos para todo el data frame que contiene la información taxonómica.
# Now to obtain the nº virulences/nº freq plots:
Genome_vf_name <- as.vector(names(table(vf_merge_filtered$Genome_ID)))
Genome_vf_count <- as.vector(table(vf_merge_filtered$Genome_ID))
df_vf_genome <- data.frame(Genome_vf_name, Genome_vf_count)
df_vf_genome <- distinct(df_vf_genome)
names(df_vf_genome) <- c("Genome_ID","Count")

df_temp <- data.frame(vf_merge_filtered$Genome_ID, vf_merge_filtered$Genus_rev)
df_temp <- distinct(df_temp)
names(df_temp) <- c("Genome_ID","Genus_rev")

df_vf_genome2 <- merge(df_vf_genome, df_temp, by="Genome_ID")

df_vf_genome3 <- merge(taxonomy_data, df_vf_genome2, all.x = T)
df_vf_genome3$Count[which((grepl("[0-9]+", df_vf_genome3$Count)==F))]<-0
Plots
El primer gráfico muestra la frecuencia relativa de presencia de cierta viruelncia, coloreada según pertenencia a los géneros más relevantes de bacterias y dividido por clase taxonómica.
ggplot(vf_merge_filtered, aes(x=Virulence))+
  geom_bar(aes(y = after_stat(count)/11430, fill = Genus_rev, alpha=0.1), stat = "count", col = "black", alpha = 0.6) +
  facet_grid(.~class, scale="free_x",space="free") + scale_y_continuous(labels=scales::percent) + xlab("VIRULENCE") + ylab("Relative Freq") +
  theme(axis.text.x = element_text(angle = 45, hjust = 1, size = 10, face = "bold"))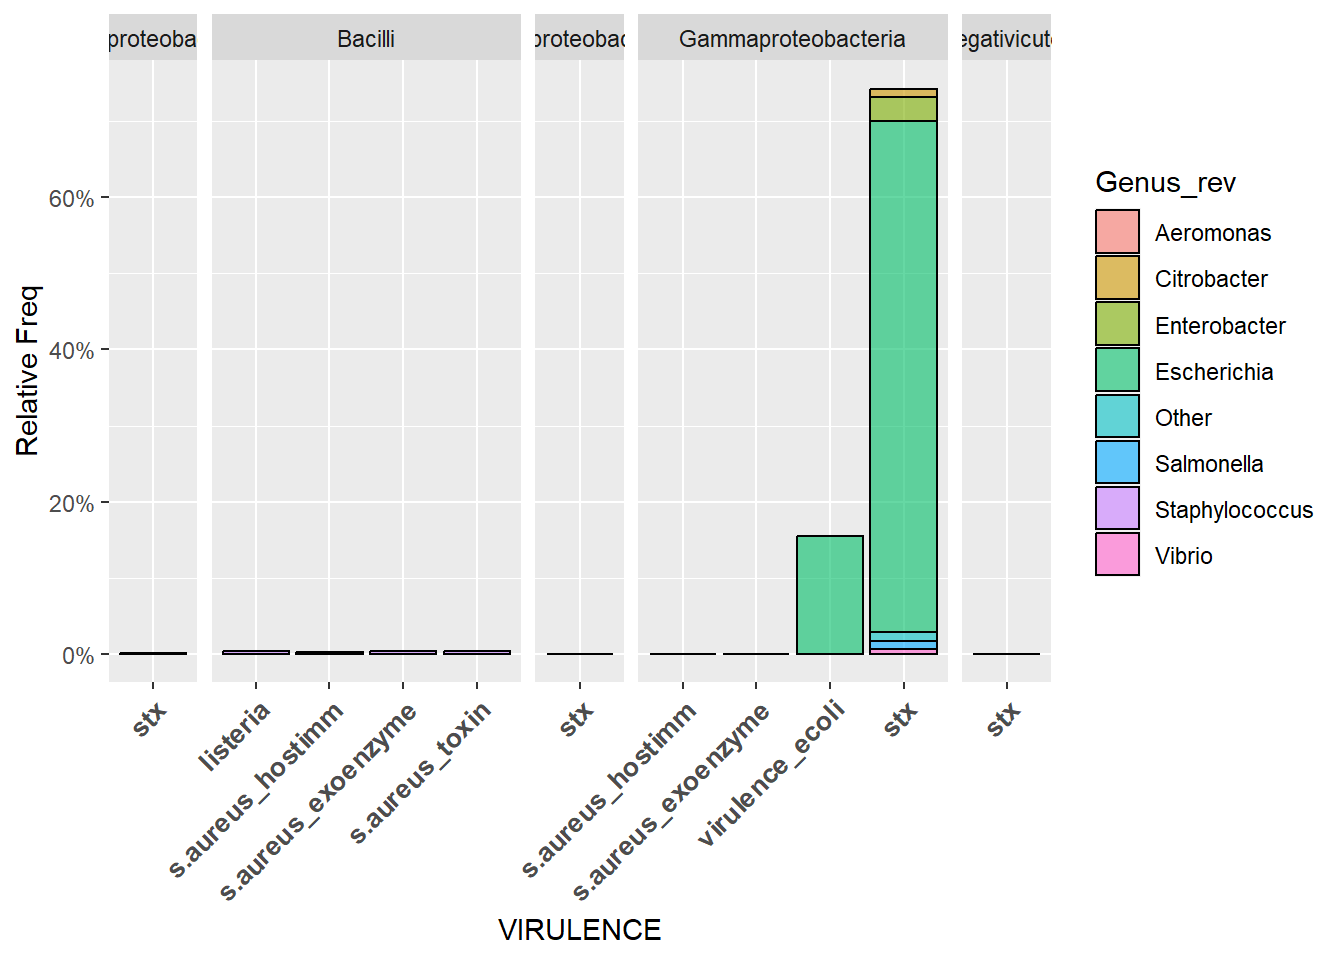
El segundo muestra qué cantidad de genomas tienen x número de virulencias, sólo para genomas que tengan al menos una.
ggplot(df_vf_genome2, aes(Count, fill=Genus_rev)) + geom_bar(stat="count") + xlab("Nº VIRULENCES") + ylab("Nº GENOMES")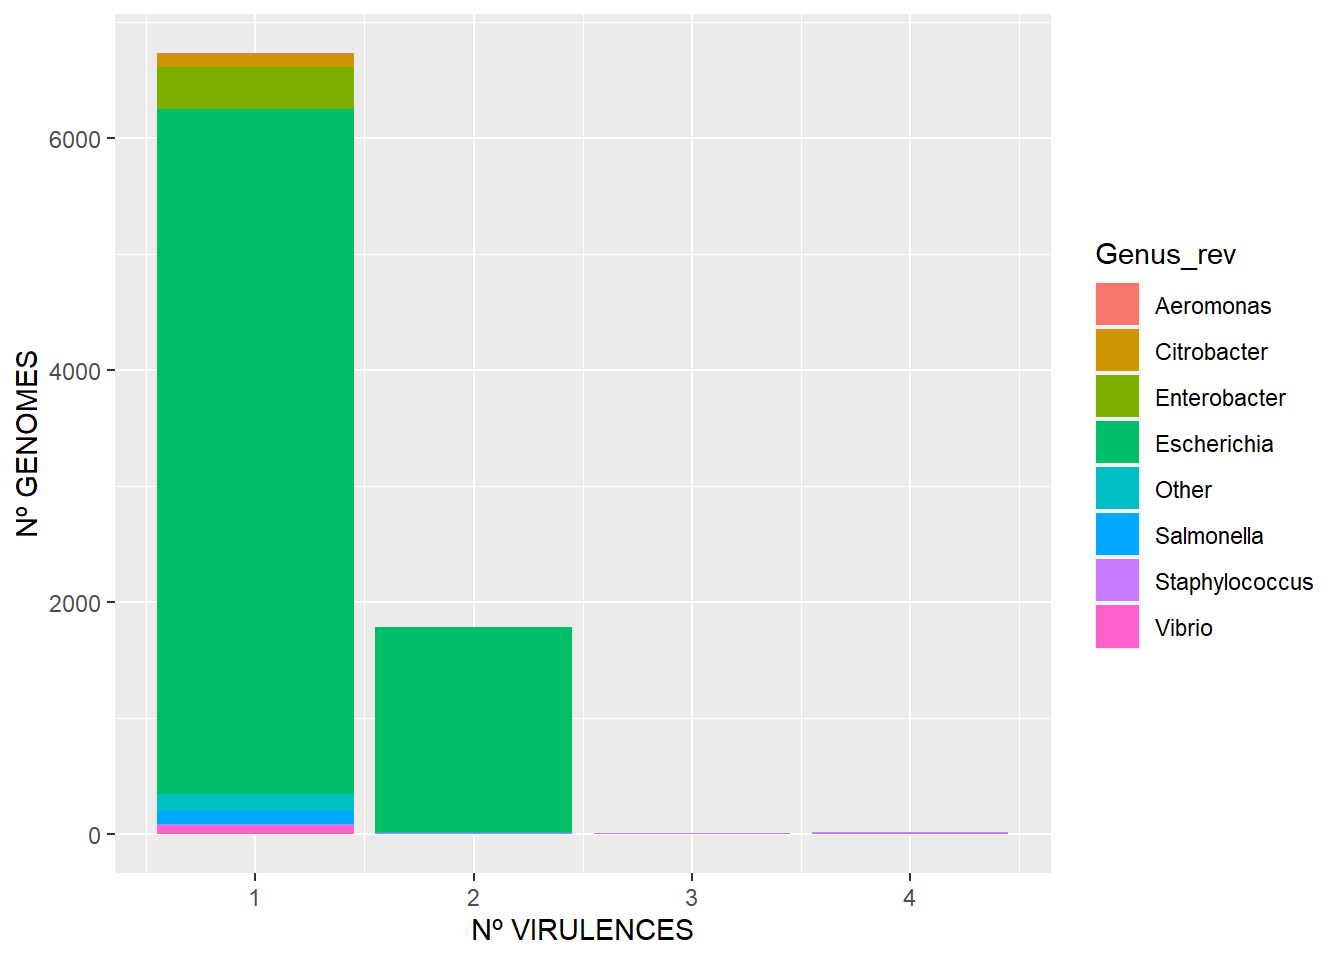
El tercero muestra qué cantidad de genomas tienen x número de virulencias, incluyendo aquellos que no presentan ninguna.
ggplot(df_vf_genome3, aes(Count, fill=Genus_rev)) + geom_bar(stat="count") + xlab("Nº VIRULENCES") + ylab("Nº GENOMES")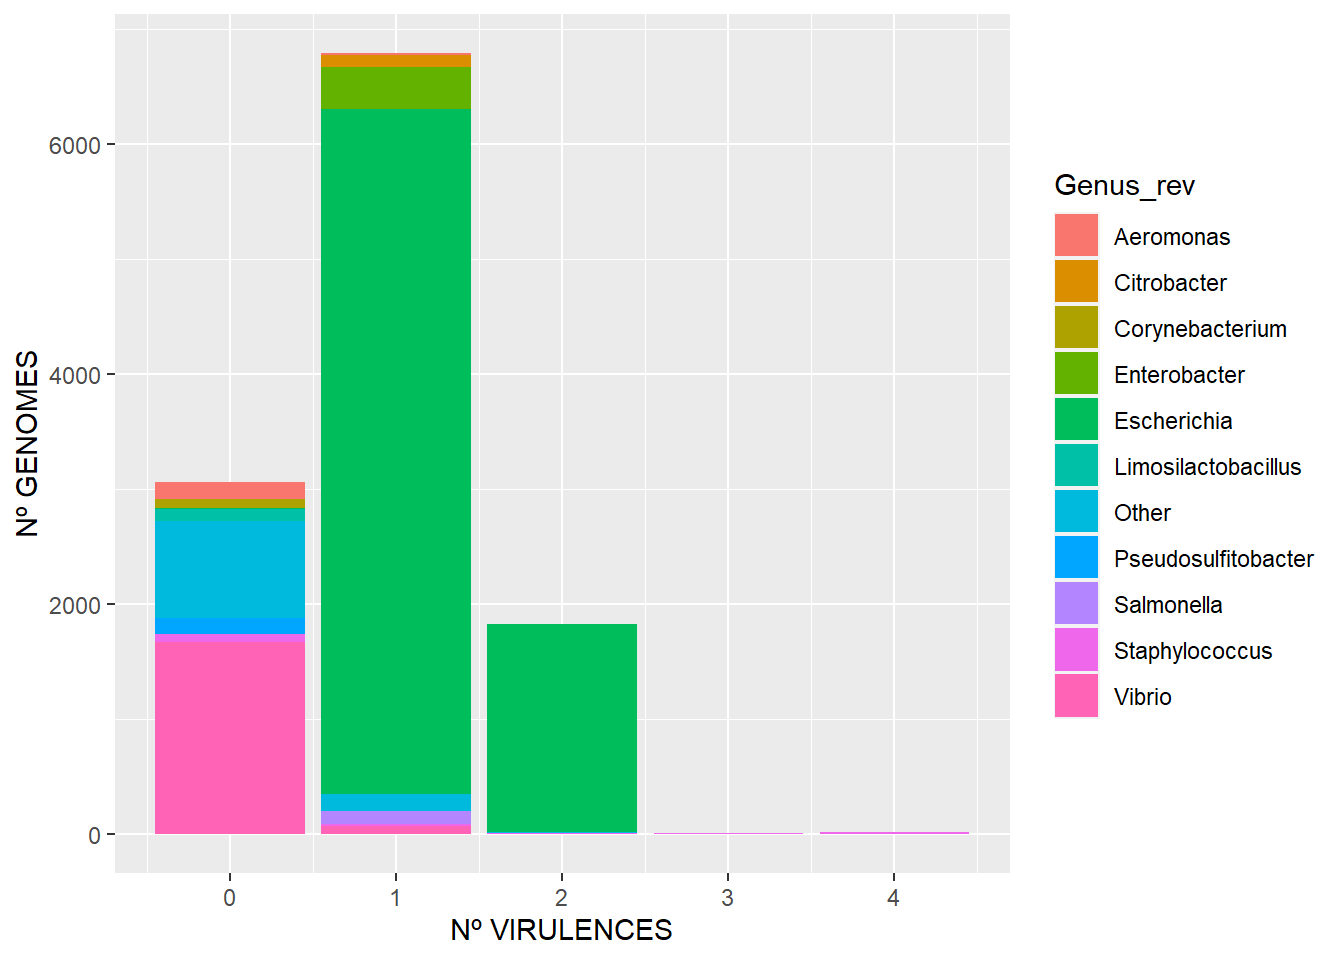
Session Info
R version 4.3.2 (2023-10-31 ucrt)
Platform: x86_64-w64-mingw32/x64 (64-bit)
Running under: Windows 11 x64 (build 22631)

Matrix products: default


locale:
[1] LC_COLLATE=Spanish_Spain.utf8  LC_CTYPE=Spanish_Spain.utf8
[3] LC_MONETARY=Spanish_Spain.utf8 LC_NUMERIC=C
[5] LC_TIME=Spanish_Spain.utf8

time zone: Europe/Madrid
tzcode source: internal

attached base packages:
[1] stats     graphics  grDevices utils     datasets  methods   base

other attached packages:
 [1] lubridate_1.9.3 forcats_1.0.0   stringr_1.5.1   dplyr_1.1.4
 [5] purrr_1.0.2     readr_2.1.4     tidyr_1.3.0     tibble_3.2.1
 [9] tidyverse_2.0.0 ggplot2_3.4.4

loaded via a namespace (and not attached):
 [1] bit_4.0.5         gtable_0.3.4      jsonlite_1.8.8    crayon_1.5.2
 [5] compiler_4.3.2    tidyselect_1.2.0  parallel_4.3.2    scales_1.3.0
 [9] yaml_2.3.7        fastmap_1.1.1     R6_2.5.1          labeling_0.4.3
[13] generics_0.1.3    knitr_1.45        htmlwidgets_1.6.3 munsell_0.5.0
[17] pillar_1.9.0      tzdb_0.4.0        rlang_1.1.2       utf8_1.2.4
[21] stringi_1.8.2     xfun_0.41         bit64_4.0.5       timechange_0.2.0
[25] cli_3.6.1         withr_2.5.2       magrittr_2.0.3    digest_0.6.33
[29] grid_4.3.2        vroom_1.6.4       rstudioapi_0.15.0 hms_1.1.3
[33] lifecycle_1.0.4   vctrs_0.6.4       evaluate_0.23     glue_1.6.2
[37] farver_2.1.1      fansi_1.0.5       colorspace_2.1-0  rmarkdown_2.25
[41] tools_4.3.2       pkgconfig_2.0.3   htmltools_0.5.7